Recently a possible proof of the ABC Conjecture has been in the news. Although the proof of this is hundreds of pages long and not really a fun read for most people, this reminded me of the prime spiral, “Ulam spiral” which we explored years ago at a meetup.
The interesting thing about ABC Conjecture is that no matter what examples or counterexamples you find to the inequality, it does not prove or disprove the theory as to where there are only finitely many specific triples to solve the inequality.
Ulam’s spiral is also a look into prime numbers, but from a visual perspective. Nothing to “prove” here but to see an interesting pattern within numbers. It was supposedly thought of by Stanislaw Ulam during a meeting, doodling numbers, and it was later popularized by Martin Gardner’s writings. It is a great way to have some fun learning how to use Matplotlib to draw up some interesting charts, too:
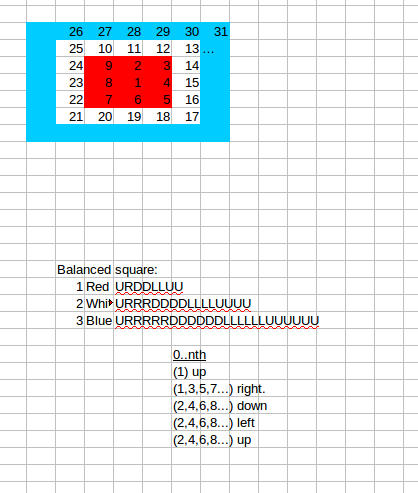
The spreadsheet, brainstorming:
The base of building the spiral is staring with 1 and spiraling the numbers around:

The Python Code:
As you can see, to make a spiral of numbers the pattern of rights, downs, lefts, ups, increases by two as the perimeter grows. I built a spiral drawer (drawing the number as above) in Matplotlib by making a function to go up/down/left/right, repeating:
from matplotlib import pyplot

def moved( tupleCurrent, direction ):
    if 'u' == direction:
        return (tupleCurrent[0], tupleCurrent[1]+1)
    if 'r' == direction:
        return (tupleCurrent[0]+1, tupleCurrent[1])
    if 'd' == direction:
        return (tupleCurrent[0], tupleCurrent[1]-1)
    if 'l' == direction:
        return (tupleCurrent[0]-1, tupleCurrent[1])

def main():
    fig = pyplot.figure()
    ax = fig.add_subplot(111)
    currentNum = 1
    currentPos = (0, 0)
    rightMoves = 1 #initially.

    while currentNum < 100:
        ax.annotate( currentNum, xy=currentPos)
        currentPos = moved( currentPos, 'u' )
        currentNum += 1
        ax.annotate( currentNum, xy=currentPos)

        #right
        for i in range( rightMoves ):
            currentPos = moved( currentPos, 'r' )
            currentNum += 1
            ax.annotate( currentNum, xy=currentPos)

        for i in range( rightMoves + 1 ):
            currentPos = moved( currentPos, 'd' )
            currentNum += 1
            ax.annotate( currentNum, xy=currentPos)

        for i in range( rightMoves + 1 ):
            currentPos = moved( currentPos, 'l' )
            currentNum += 1
            ax.annotate( currentNum, xy=currentPos)

        for i in range( rightMoves + 1 ):
            currentPos = moved( currentPos, 'u' )
            currentNum += 1
            ax.annotate( currentNum, xy=currentPos)

        rightMoves += 2


    ax.set_ylim(-20,20)
    ax.set_xlim(-20,20)
    pyplot.show()
    x = raw_input('Highlight: ')


if __name__ == '__main__':
	main()
This can be separated from other logic using an interesting feature in Python, the Yield keyword, which lets you use return multiple return values, later. For example if I want a function to keep multiplying a result by three, I could use:
def yielder(mult):
  initial = 1
  while True: #initial < 10:
    initial = initial * mult
    yield initial


for i in yielder(3):
   print(i)
   print type(i)
   if( i > 100000000000000000000000000000000000000000000000000000000000000000000000000000 ):
       break

print( 'ya!' )
To output 3, 9, 27, …. multiplying by 3 each time, and only breaking out of the loop in the calling function.
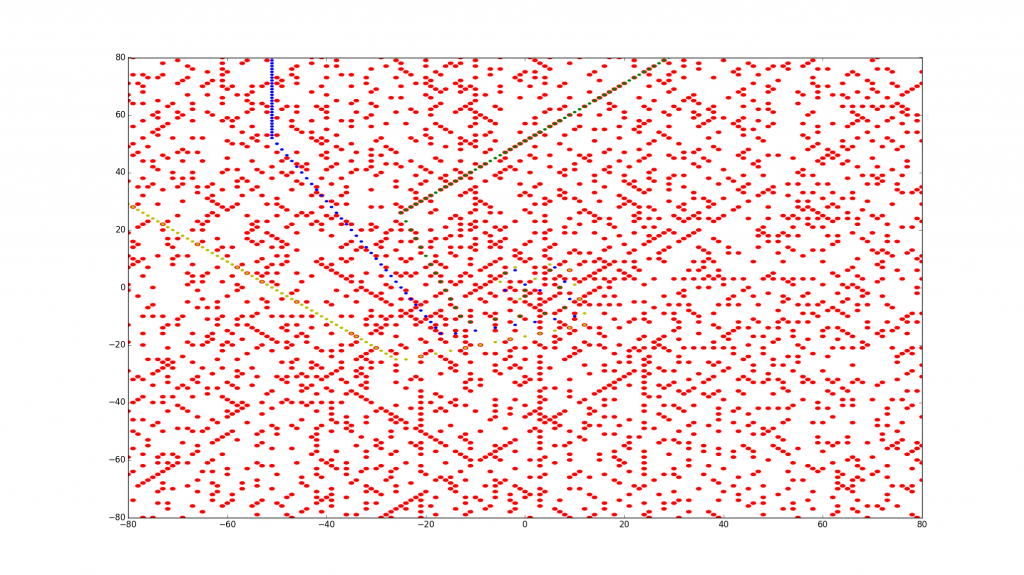
Now the interesting part… adding in this spiral-function and plotting which of those are primes. If you highlight the areas that are prime (primes1.txt from here should be useful), you will see a cool pattern. Furthermore, you’ll see “lines” of primes that often go along the lines of a polynomial – for example, 4x^2 – 2*x + 41, with values of 0,1,2,3… and on for X, very often give prime numbers!
>>> print([ 4*x*x - 2*x + 41 for x in range(1000) ])
[41, 43, 53, 71, 97, 131, 173, 223, 281, 347, 421, 503, ....
Weird. You can see this one in green, and other polynomial based numbers shown in other colors as documented here. This whole thing takes a number of minutes to run but shows an interesting pattern at the end:
from __future__ import division
from matplotlib import pyplot

def moved( tupleCurrent, direction ):
    if 'u' == direction:
        return (tupleCurrent[0], tupleCurrent[1]+1)
    if 'r' == direction:
        return (tupleCurrent[0]+1, tupleCurrent[1])
    if 'd' == direction:
        return (tupleCurrent[0], tupleCurrent[1]-1)
    if 'l' == direction:
        return (tupleCurrent[0]-1, tupleCurrent[1])

def spiral( start ):
    currentNum = start
    rightMoves = 1 #initially.

    currentPos = (0, 0)
    while currentNum < 160*160:
        yield ( currentNum, currentPos)
        currentPos = moved( currentPos, 'u' )
        currentNum += 1
        yield ( currentNum, currentPos)

        #right
        for i in range( rightMoves ):
            currentPos = moved( currentPos, 'r' )
            currentNum += 1
            yield ( currentNum, currentPos)

        for i in range( rightMoves + 1 ):
            currentPos = moved( currentPos, 'd' )
            currentNum += 1
            yield ( currentNum, currentPos)

        for i in range( rightMoves + 1 ):
            currentPos = moved( currentPos, 'l' )
            currentNum += 1
            yield ( currentNum, currentPos)

        for i in range( rightMoves + 1 ):
            currentPos = moved( currentPos, 'u' )
            currentNum += 1
            yield ( currentNum, currentPos)
        rightMoves += 2


def main():
    fig = pyplot.figure()
    ax = fig.add_subplot(111)
    currentNum = 1

    #Primes from https://primes.utm.edu/lists/small/millions/primes1.zip
    with open('primes1.txt') as primesfile:
        primes = [int(p) for p in primesfile.read().split()]

    funct = raw_input('Highlight(x): ')
    #xs = [ eval( funct ) for x in range(1000) ]
    xs = [ 4*x*x - 2*x + 41 for x in range(1000) ]
    xs3 = [ 4*x*x - 3*x + 41 for x in range(1000) ]
    xs4 = [ 4*x*x - 4*x + 41 for x in range(1000) ]
    print xs
    total = 0
    primeCount = 0
    inFunction = 0
    inFunctionAndPrime = 0
    for ( num, pos ) in spiral(92):
        total += 1
        #ax.annotate( num, xy=pos, horizontalalignment='center')
        if num in primes:
            ax.add_artist( pyplot.Circle( pos, 0.5, color='r'))
            primeCount += 1
        if num in xs3:
            ax.add_artist( pyplot.Circle( pos, 0.3, color='b'))

        if num in xs4:
            ax.add_artist( pyplot.Circle( pos, 0.3, color='y'))

        if num in xs:
            ax.add_artist( pyplot.Circle( pos, 0.3, color='g'))
            inFunction += 1
            if num in primes:
                inFunctionAndPrime +=1
    print ('prime portion overall: %s' % ( primeCount / total ) )
    print ('prime portion of function: %s' % ( inFunctionAndPrime / inFunction ) )


    ax.set_ylim(-80,80)
    ax.set_xlim(-80,80)
    pyplot.show()


if __name__ == '__main__':
    main()
Note that you can replace the above “xs = ” line with the one above and plot whatever function you input – “2x” for example would make every other number colored in by the color.

Note the green, the function noted above, is on a lot of primes (red dots). Other polynomials may or may not point out a line of primes – see the yellow which gives some primes too, but more composites:
>>> [ 4*x*x - 4*x + 41 for x in range(10) ]
[41, 41, 49, 65, 89, 121, 161, 209, 265, 329]
It would seem to be somewhat odd that numbers that cannot be multiples of any intermediate numbers, primes, can often be a result of polynomial functions like that. It seems there are patterns in nature we have only just begun to fully understand?
If you don’t like Matplotlib, there are some interesting other implementations in Python and other languages at RossetaCode. It doesn’t seem as readable as using Yield though.
