
Last week it was announced that high flu cases are having effects on the health system in Jackson County, Oregon. A top recommendation on the OPB article says to get vaccinated for Flu – does this recommendation play out in the statistical data though?
Analyzing Oregon health data by County
The OHA has data for 2019-2020 as their latest flu immunization data reported here. Unfortunately this is older data, but we might assume that a similar number of people get shots every year. In fact if you look back years before more vaccinated populations generally had some similar statistics for their previous years. I grabbed the totals of the various counties, checking the average and sorting: This is not an entirely accurate assumption unless there are there were actually 1/3 younger, 1/3 older and 1/3 middle aged populations in each of these counties… but this should at least get us an idea of the most and least vaccinated counties:

| Percent vaccination: | 18 to 49 | 50 to 64 | > 65 yrs | Average of groups |
| Deschutes | 38.2 | 59.5 | 74.1 | 57.3 |
| Washington | 40.6 | 58.1 | 72.1 | 56.9 |
| Multnomah | 38.9 | 55.6 | 69.4 | 54.6 |
| Marion | 33 | 53.6 | 76.3 | 54.3 |
| Lane | 36 | 57.5 | 69.4 | 54.3 |
| Crook | 39.8 | 55.4 | 65.8 | 53.7 |
| Hoodriver | 37.3 | 56.3 | 65.2 | 52.9 |
| NorthCentral | 35.9 | 55.7 | 62.3 | 51.3 |
| Wallowa | 43.5 | 51 | 57.9 | 50.8 |
| Yamhill | 30.8 | 48 | 68.6 | 49.1 |
| Tillamook | 32.4 | 49.9 | 64 | 48.8 |
| Clatsop | 34.6 | 49.8 | 60.1 | 48.2 |
| Columbia | 30.8 | 49.8 | 63.3 | 48.0 |
| Coos | 30.6 | 49.9 | 61.8 | 47.4 |
| Wheeler | 29.9 | 48.8 | 60.5 | 46.4 |
| Jackson | 29.5 | 44.6 | 62.8 | 45.6 |
| Umatilla | 29.2 | 47.7 | 54.7 | 43.9 |
| Jefferson | 33.2 | 42.3 | 53.6 | 43.0 |
| Union | 29 | 45 | 54 | 42.7 |
| Douglas | 23.3 | 42.5 | 62.1 | 42.6 |
| Lake | 27.9 | 40.8 | 57.8 | 42.2 |
| Morrow | 31.6 | 45.9 | 48.1 | 41.9 |
| Harney | 32.5 | 43.8 | 47.7 | 41.3 |
| Baker | 28.3 | 44.1 | 51.5 | 41.3 |
| Josephene | 25.9 | 41.1 | 55.8 | 40.9 |
| Klamath | 24.6 | 41.6 | 53 | 39.7 |
| Grant | 27.2 | 38.4 | 49.1 | 38.2 |
| Curry | 18 | 38.5 | 54.7 | 37.1 |
| Malheur | 19.6 | 37.2 | 43.2 | 33.3 |
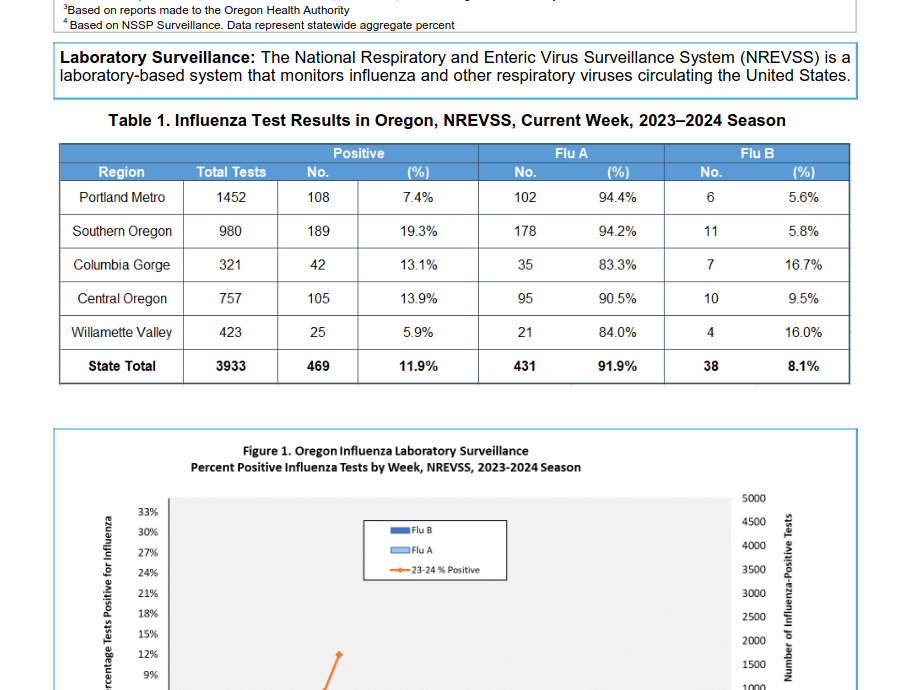
As you can see, Jackson and Josephene, Klamath counties are among the lower vaccination rates for influenza. Also, the recent reporting lists these southern Oregon counties as having the highest percentages of positive tests for Flu, just last month:
Analysis
You can see in the left most percentage column, the total, that Southern Oregon has had the most tests and also the highest percentage out of those tests. The lowest were among Portland Metro and Willamette valley, which are regions which had the higher vaccination rates in the above table.