
In recent years there has been a lot of talk about solar and more renewable energy. In USA the recent IRA has provisions for extending solar and renewable energy, and the Florida governor last year supported Solar benefits which turn out to be helpful in many natural disasters, making an energy grid more easily self-sustainable after hurricanes that are common to that state. What if we could go over a map and see what buildings are the best candidates for solar generation? OpenStreetMap has not just street maps, but many other features, including building coordinates, which can give us polygons that can calculate areas for potential solar!
Extracting data
OpenStreetMap is an open source project that backs OsmAnd for Android, and many other map apps and online views. To download the Openstreetmap building data for a certain area to analyze, you can select it in https://extract.bbbike.org and you will receive an emailed zip file. Unzip the contents and you’ll see various data files in the /shape/ directory… you will see files buildings.cpg, .dbf, .prj, .shp, .shx, which are all part of a shapefile. There is a Python library for reading these coordinate data: Read the documentation and installation instruction here. In a Linux terminal:
pip3 install pyshpAfter installation you can read each building by its coordinates at the terminal:
python3
>>> sf = shapefile.Reader('shape/buildings')
>>> >>> sf.shape(0).points
[(-122.8775256, 42.3667486), (-122.877181, 42.3669166), (-122.8772297, 42.3669711), (-122.877153, 42.3670085), (-122.8772336, 42.3670988), (-122.8773551, 42.3670397), (-122.8773623, 42.3670476), (-122.8775614, 42.3669506), (-122.8775544, 42.3669427), (-122.877655, 42.3668937), (-122.8776486, 42.3668865), (-122.8777309, 42.3668464), (-122.8776185, 42.3667205), (-122.8775363, 42.3667605), (-122.8775256, 42.3667486)]
These are all the (lon,lat) points of the building, which define a place on earth with one number east and west, one number representing north to south positioning. len(sf) is 8741 in this case so sf.shape(4740) is the last shape in the area.
Calculating the area of buildings
The Shoelace formula is an interesting way to find the area of any region based on the points defining it. You can check it out in an Excel or Libreoffice spreadsheet by defining each point and calculating it like so:
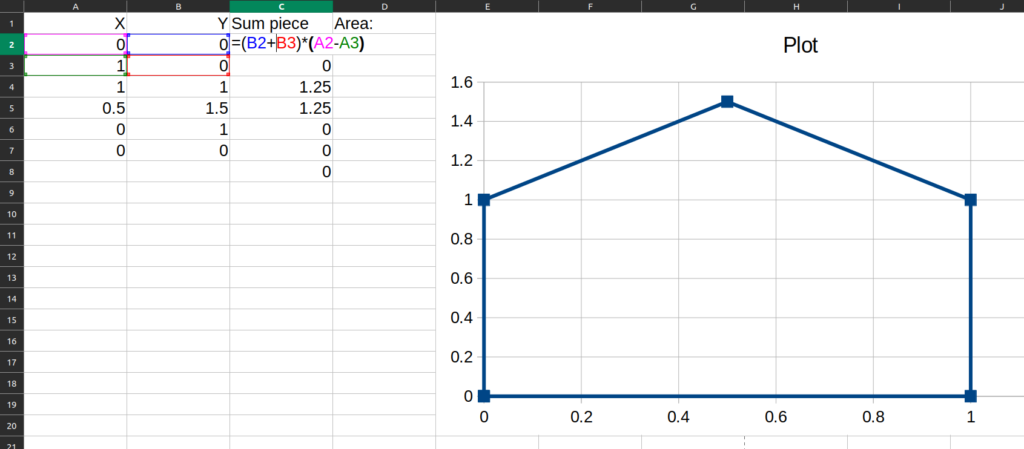
Use the corner square to drag C2 in this formula downward to fill the column. In the area cell take the sum of those pieces, times 1/2. This adds and subtracts to give the area of the area defined by the points. If you enter the points in the reverse direction (clockwise in this forumulation), “area” will be negative, but still the correct area!
Check it out yourself downloading this file and trying your own points as shown above! If you use and older Excel please use this file for the shoelace formula.
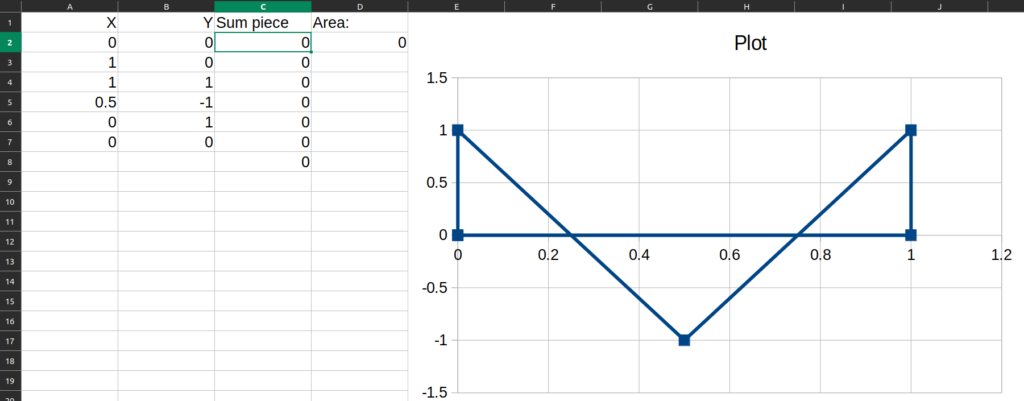
Where it doesn’t work – is where it overlaps itself without defined point going around the area properly:
Programmatic calculation of the building areas
Above I have shown a way to pull building data out of OpenStreetMap, and a way to calculate areas of the points. Using the usual Python for loop with each of the gps points, we can step through every building polygon to do a variant of the shoelace formula to find the area point by point:
#!/usr/bin/env python
import shapefile
from math import radians, sin, cos

def main(args):
    sf = shapefile.Reader('shape/buildings')
    earthRm = 6378137 #Earth radius, meters
    buildingNum = 0
    buildings = {}
    while buildingNum < len(sf):
        area = 0
        pts = sf.shape(buildingNum).points
        if len(pts) > 2:
            lastpt = False
            for pt in pts:
                if lastpt:
                    p1Longitude = lastpt[0]
                    p2Longitude = pt[0]
                    p1Latitude = lastpt[1]
                    p2Latitude = pt[1]
                    area += radians(p2Longitude-p1Longitude) * (2+sin(radians(p1Latitude))+sin(radians(p2Latitude)))
                lastpt = pt
        area = round(abs(area * earthRm * earthRm / 2));
        print('%s area = %s' % (sf.shape(buildingNum).shapeTypeName, area))
        buildingNum += 1
        buildings[area] = pts

    areasorted = sorted(buildings)
    n = 3
    print('%s smallest buildings:' % (n,))
    for i in areasorted:
        n-=1
        if n>=0:
            print('%s m^2:' % (i,))
            print('https://www.google.com/maps/search/%s,%s' % (buildings[i][0][1], buildings[i][0][0]))
            print('https://www.openstreetmap.org/search?query=%s,%s' % (buildings[i][0][1], buildings[i][0][0]))
            print(buildings[i])
    n = 3
    print('%s largest buildings:' % (n,))
    for i in reversed(areasorted):
        n-=1
        if n>=0:
            print('%s m^2:' % (i,))
            print('https://www.google.com/maps/search/%s,%s' % (buildings[i][0][1], buildings[i][0][0]))
            print('https://www.openstreetmap.org/search?query=%s,%s' % (buildings[i][0][1], buildings[i][0][0]))
            print(buildings[i])
    return 0

if __name__ == '__main__':
    import sys
    sys.exit(main(sys.argv))
As you can see here, the output will give largest buildings (the ones that would be good candidates for solar), and smallest – which are just random sheds in back yards generally. Unfortunately it also seems to count property boundaries/fences.